Putting Construction on a Map
Picture this: your project data seamlessly integrated into an easy-to-navigate map, available at your fingertips anytime, anywhere.
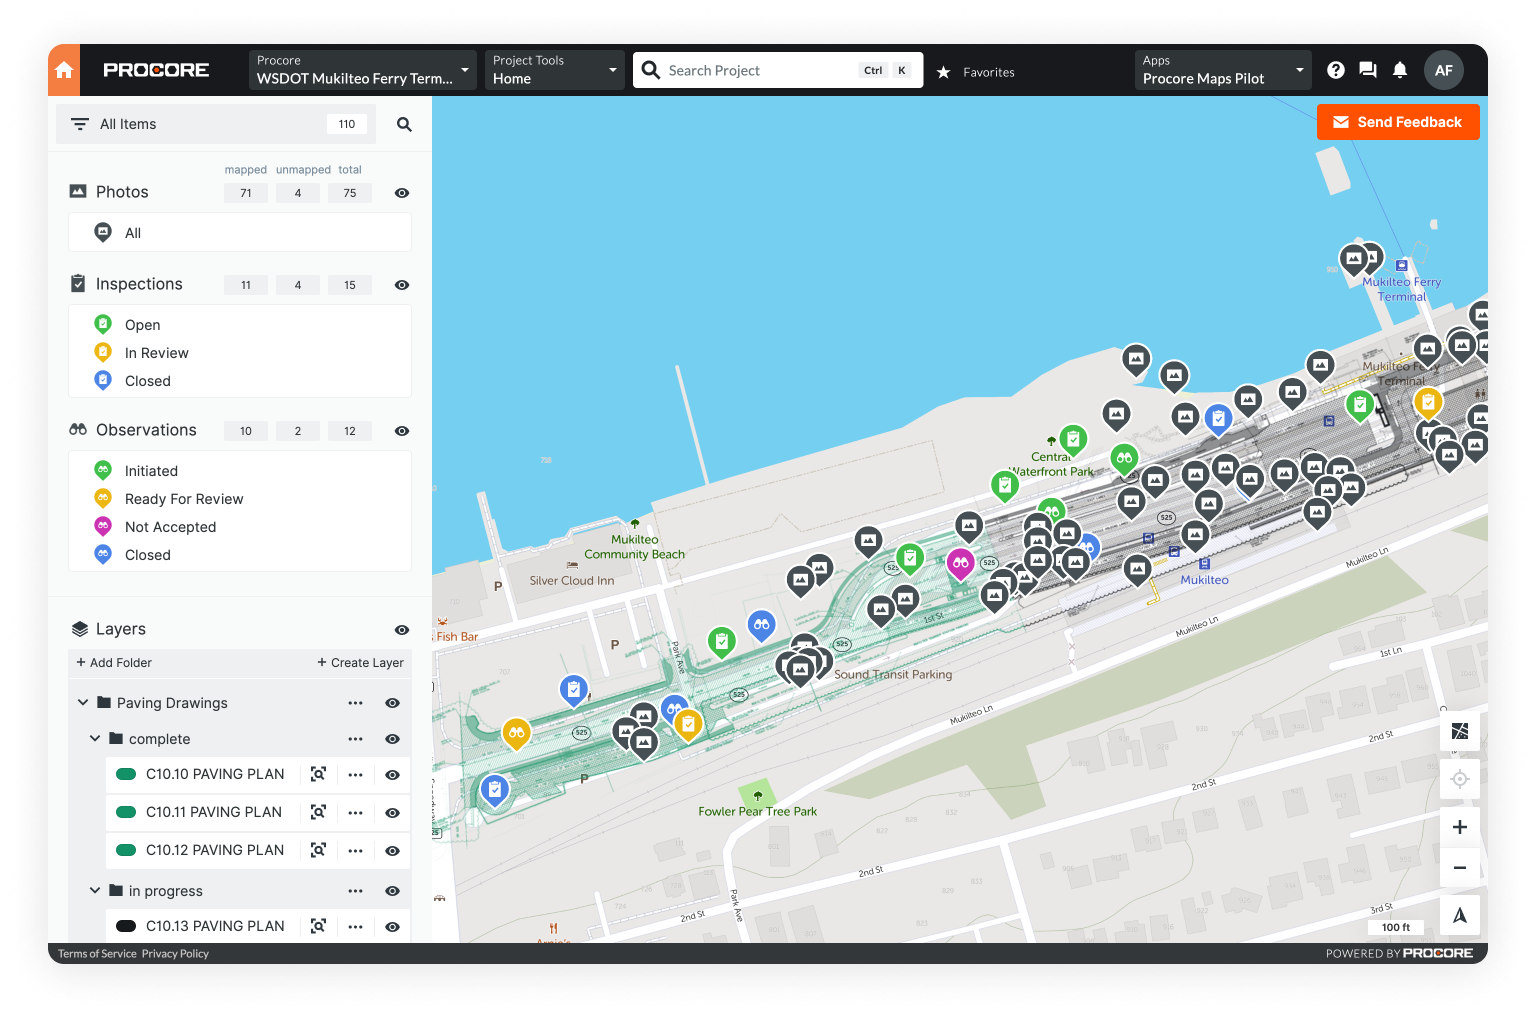
We're currently hard at work, integrating cutting-edge mapping technology into Procore. This integration aims to meet the needs of projects where location accuracy is essential, such as horizontal projects. A few highlights to look forward to:
View your data on a map, relative to your own location, in order to quickly make informed decisions.
Visualize location-based construction progress on any type of project, whether you’re working on a bridge or skyscraper.
Understand the lay of the land. Efficiently navigate to where your attention is needed and get to work faster.