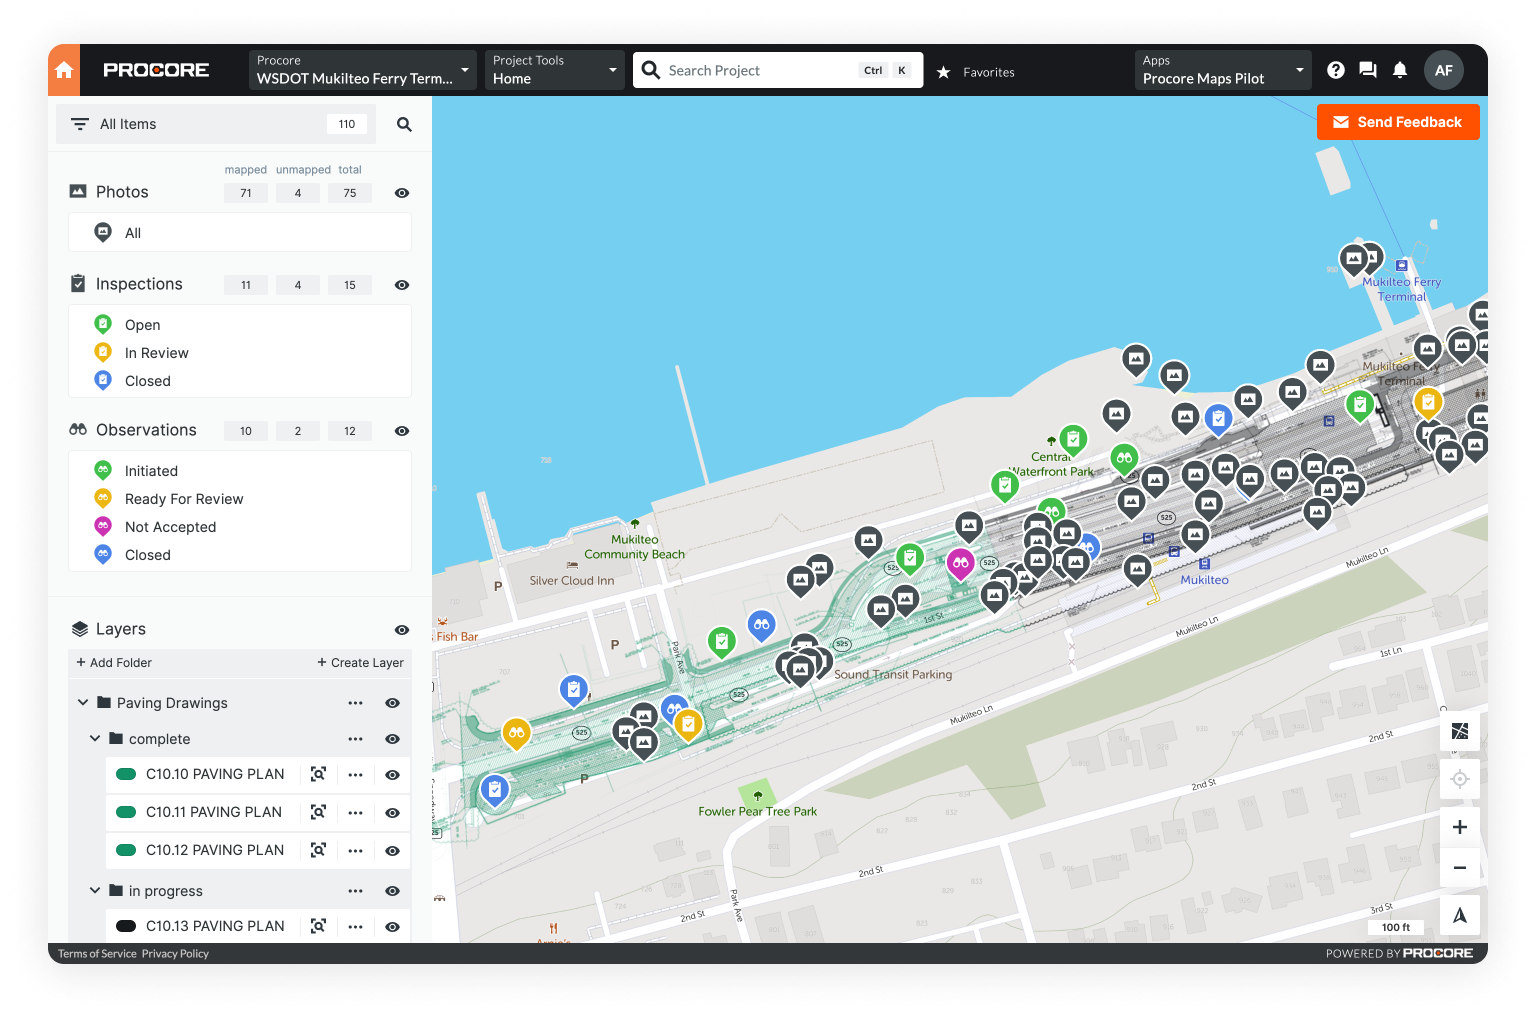
GIS for Utilities | Optimize asset inspection and maintenance

Utilities are an integral and often overlooked part of modern society. Functional utility networks ensure that water comes from the faucet, gas runs to the stove or furnace, and electricity powers your lights.

It should come as no surprise that utility infrastructure networks are massive and complex. They must effectively connect, not only to the sources of water, gas, and electricity, but to every house, business, and high-rise in a given area.

Building, inspecting, and maintaining utility networks presents significant challenges. Luckily, geographic information systems (GIS) and its field application - Mobile GIS - present the ideal solution.

New to GIS? Explore the basics in our blog Intro to GIS: What It Is and How to Get Started.

With GIS for utilities, providers can track infrastructure build projects, document inspections, and streamline maintenance processes - increasing operational efficiency all across the board.

This post explores how GIS can benefit utilities, as well as three specific use cases for GIS in everyday utility operations: asset management, outage management, and cross bore detection and mitigation.

Benefits of Using GIS for Utility Inspections & Management

Water, gas, and electric all stand to benefit from GIS mapping software for utilities. Below we focus on how GIS increases efficiency for utility field operations by digitizing the data collection process, as well as how a single system for effective data storage and management increases the quality and accessibility of historical data.

Increased efficiency for field operations

Utility field operations are essentially a cycle of inspection and maintenance. Utility inspectors examine assets, document what they find, and schedule or perform any necessary maintenance.

Keeping up with consistent inspection and maintenance is a formidable task faced by two primary roadblocks: huge territories that generate massive amounts of geo-located data, and budgetary restraints that restrict manpower.

GIS to manage utility field operations

The sheer size and scope of most utility territories makes for an average inspection cycle of about five years.

The traditional process is somewhat inefficient, relying on hardcopy paper maps and other point solutions.

Generally, the inspection process goes something like this:

1. Project managers print paper maps of the inspection area


2. Field teams perform inspections and document findings with a combination of photos, videos, and handwritten notes


3. Field crews return to the office where data is manually transferred or logged into the larger organizational system

A paper-based process presents a variety of challenges.

Mainly, it slows down the inspection process overall and opens up opportunities for error and rework. Review is delayed as the office must wait for field teams to return, paper maps get damaged or lost, and incomplete information isn't caught until field teams are already back in the office.

GIS digitizes the inspection and maintenance process: minimizing opportunities for error, eliminating manual data transfer, and reducing rework.

With cloud-based GIS or a Mobile GIS app (to supplement the desktop system), field teams can collect data directly into the GIS and then transfer to the office via digital means. Rather than storing data across a variety of devices, all data is automatically organized by location and stored within the same unified system.

Deep dive: How to Streamline Field Data Collection with Mobile GIS

Effective data storage and management

Collecting field data is only one part of the larger utility inspections and maintenance picture. The other component is storing, sharing, and managing that same data.

Historically, data management relies on a combination of paper maps, Excel spreadsheets, and even DVDs. Taken to the scale of most utility providers this approach becomes problematic. In part, it's simply an issue of volume.

GIS for utility data management

Some crews perform hundreds of inspections per year. If each inspection generates a paper map, multiple documentation forms, and a DVD with photos and videos - it's easy to see how that could quickly get out of control.

Organization and ease of access aside, you would need a separate room in your office simply to store all of those items.

With this kind of system, sustainability becomes a serious issue.

As more and more data is collected and literal boxes of documentation accumulate, department priorities shift and personnel changes. Time passes and finding historical data becomes increasingly difficult.

Effective access to historical data is important because it informs future maintenance schedules, tells field crews what has or hasn't been done in an area, and gives project managers a framework for long-term planning.

GIS enables utilities to automatically organize information by location and store all network data in a single platform - one that doesn't require boxes of documents or burning DVDs.

Moreover, finding and accessing data within a GIS doesn't depend on the knowledge of a single person: anyone can open the program and, as long as files are saved appropriately, immediately access the data they need.

Applications for GIS in Utilities

Below we dive into three specific applications for GIS in utilities, including utility asset management, outage management, and cross bore detection and mitigation.

GIS for utility asset management

Utility asset management refers to the tracking and analysis of an asset's location, maintenance requirements, lifecycle stage, and overall performance.

In the short term, effective asset management allows utilities to deliver reliable services. In the long term, it decreases operational costs while increasing asset and network lifespan.

Infrastructure networks spread over vast territories and consist of thousands, if not millions of distinct assets: pipelines, gas meters, power lines, and so much more.

Moreover, each territory has its own topography, climate, and regulatory standards.

Collecting, organizing, and sharing data effectively in such a context can be difficult; however, with GIS tools companies can streamline and simplify their approach.

For example, with GIS for water utilities, you could place a map of pipelines, meters, and water treatment facilities over a street map, over a topographic map - creating a near instant overview of the territory.

Project managers can share that same map with field crews, who can then add data directly to an asset while still in the field. In this case, data might include photos, videos, notes about asset's state, or even drone imagery.

GIS helps utilities track asset health proactively: extending an asset's lifecycle and reducing operating costs.

Cloud-based GIS is a particularly good fit for asset management in the field. These programs enable real-time updates, reduce manual data transfer, and tend to be more user friendly than your average desktop GIS platform.

Deep dive: 6 Steps to Maximize Your Utility Asset Management Program

Outage management

Power outage management is a perfect use case for GIS in utilities.

Power failures cause massive financial losses for electricity providers and local businesses. In fact, eight major markets in the U.S. forfeit nearly $27 billion each year to losses from power outages.

GIS can help prevent some of these losses.

GIS for electric utilities can enhance power outage management with real-time data mapping i.e. creating a map of the system’s physical assets and showing a graphic display with the size and effect of atmospheric events.

GIS enables faster response times for maintenance crews by helping to forecast the location and severity of potential outages.

The faster a crew is dispatched, the faster damages are resolved, the faster power is restored. Less time between outage and restoration means more money saved by the provider and less inconvenience for those in the affected area.

Deep dives:

The Urgent Case for Mobile GIS in Utility Storm Response
How Extreme Weather Threatens Utility Storm Response
It's Time to Rethink Damage Assessments

Cross bore detection and mitigation

Cross bores are the intersection of an existing underground utility by a second utility i.e. a gas line accidentally bored through a sewer line.

Usually a byproduct of trenchless drilling, cross bores are quite dangerous and have caused numerous gas explosions throughout the United States.

cross bore illustration

With an estimated 1 million cross bores hidden throughout 2.5 million miles of pipeline in the U.S. - the problem is surprisingly widespread.

Manual inspection is the most effective way to detect and resolve a cross bore, however with that much pipeline the process is slow and difficult to manage.

GIS can help utilities increase the efficiency of their cross bore detection and mitigation programs by streamlining field data collection and management of historical data.

With GIS, program managers can create a map of the work area and assign parcels to inspection crews with a few clicks. Field crews can then upload inspection data directly on the map. All data is automatically saved to it's location on the map for convenient future access.

Though GIS can't actually fix a cross bore, it can help cross bore detection and mitigation teams work faster and more efficiently - increasing safety for all.

Deep dive: Why Mobile GIS is Critical in Cross Bore Detection and Mitigation

Conclusion

As you can see, GIS offers significant benefits to utilities and can be used in a variety of ways.

Ultimately, the benefits boil down to increases in operational efficiency and better data management. Field crews can cut down on redundant work, office teams get data faster, and important data is readily available to anyone who needs it.

Unearth's Mobile GIs on a laptop and mobile phone

Explore GIS applications within other industries:

Telecom
Oil & Gas
Urban Planning
Construction


Get the latest in infrastructure news. Sign up for our newsletter.